Analysing India's Covid-19 data by State
Based on data available publicly, here’s some analysis by
state on the COVID-19 cases and recoveries in India (on 04-Sep-20):
Since its first novel coronavirus case in Jan-20, India has
had a total of 3936747 cases. This is 15% of the total cases in
the world. Percentage recovery in India is at 77%, while worldwide it is
67%. Percentage fatalities in India are 1.74%; worldwide they
stand at 3.31%.
Within India’s states, Maharashtra contributed to over 20%
of nationwide cases. Percentage of fatalities in Maharashtra compared to the
total in India too is highest at over 15%.

Given the varying populations of India’s states, comparing
absolute numbers is misleading. Here, the linear scale used is number of cases
by million in each state, along with the population density of each state
(graph below). Among states, Delhi stands out with its population density way
higher than that of any other state.
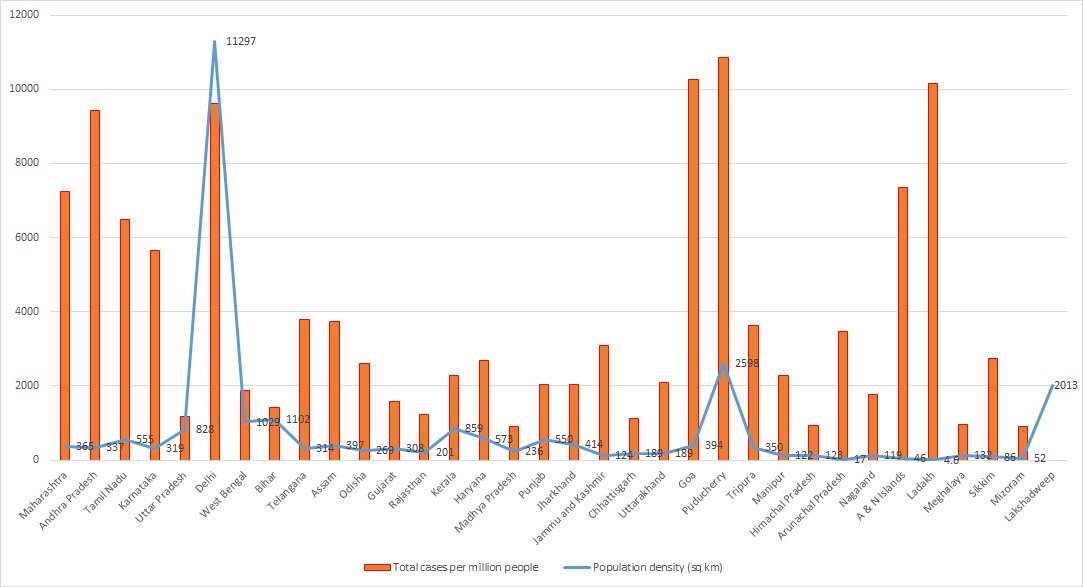
Expectedly, it also has a very high number of Covid cases. However, some other states/Union territories such as Goa, Puducherry and Ladakh having with much lower population densities have very high number of cases per million. This is particularly surprising in the case of Ladakh, which has very low population density.
India’s most populous state, Uttar Pradesh has contributed
to just over 6% of total national tally (graph above), although its
population is about 16% of the national population. It also has a low
number of cases per million. Lakshadweep Islands have managed to shield
themselves altogether from the infection that’s swept the world. Andaman &
Nicobar Islands on the other hand have been less fortunate, with over 7300
cases per million of population.
In a socially and economically diverse population like
India’s, there could be dozens of factors by district that have impacted the
spread (or cure and containment) of the infection. Some of the more significant
ones may be – extent to which state governments were able to impose and sustain
the lockdown, awareness (related to literacy?) levels of the population of
districts and states, dominant industry – agriculture, manufacturing, etc –
availability of medical professionals per million of population, availability
of beds in hospitals, per capital income and financial sustainability.
While this is just a quick and high level analysis based on
publicly available data, once this pandemic is behind us, governments across
the world will have their jobs cut out to collate and analyse dozens, perhaps
hundreds of factors that have contributed to or controlled the spread of this
infection, and invest in being better prepared on multiple fronts for such a
situation, even though one hopes the world never faces it again. Equally
importantly, the world community needs to use diplomatic means to ensure no
country is inspired by 2020 to launch a global misadventure in future.

Comments
Post a Comment